The Statistics Communication section is organising an exciting workshop on building dashboards in R.
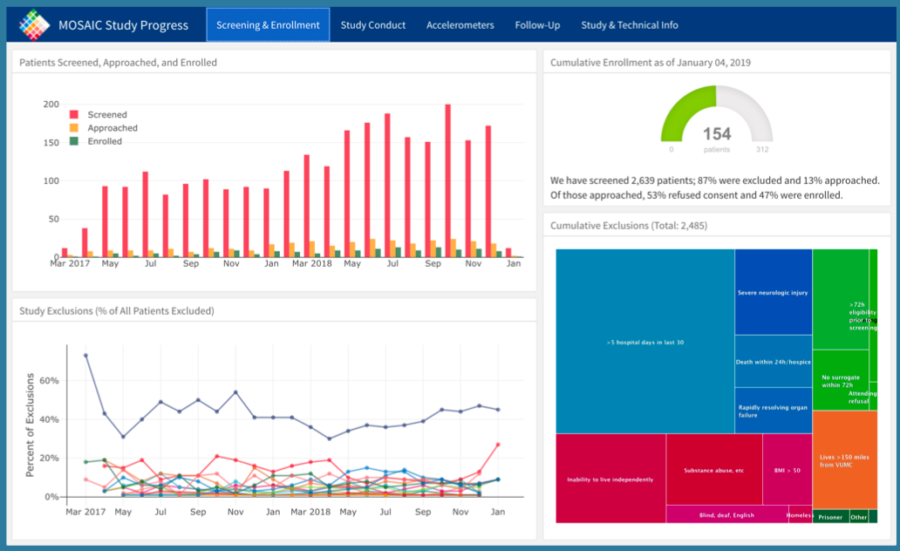
A data dashboard helps to communicate you statistical results; it summarises and visualises your data and highlights the main conclusions. It can connect to your data files but on the surface it only shows this data in the form of tables, line charts, bar charts and gauges. In this way you can easily monitor your data and share the results with others.
Programme:
17.40 – 18.00: Arrival participants (coffee, tea, sandwiches)
18.00 – 18.15: Welcome & intro Statistics Communication and R-ladies
18.15 – 19.00: Workshop part 1
19.00 – 19.15: Break
19.15 – 20.00: Workshop part 2
20.00 – 21.00: Drinks
Location:
The workshop is at BeJa Cursuslocatie and Catering in the St. Nicolaaslyceum in Amsterdam (Beethovenplein 2, 1077 WM Amsterdam). This is a 5-minute walk from Amsterdam-Zuid Station.
Food:
Vegetarian and non-vegetarian sandwiches will be served upon arrival (max. 2 per person).
 Speaker: Olga Sholderer
Olga is a data enthusiast who spends her days automating and optimizing data processes using R. With her passion for education, she has given several well received R Workshops for i.a. the R-Ladies. She is a Senior Associate, Data Services at AACSB International. She earned her degrees in Political Science and Public Administration and previously worked in non-profits and international organisations.
You can attend the workshop for free, but registration via this registration form is required for catering purposes and due to the limited number of places available.